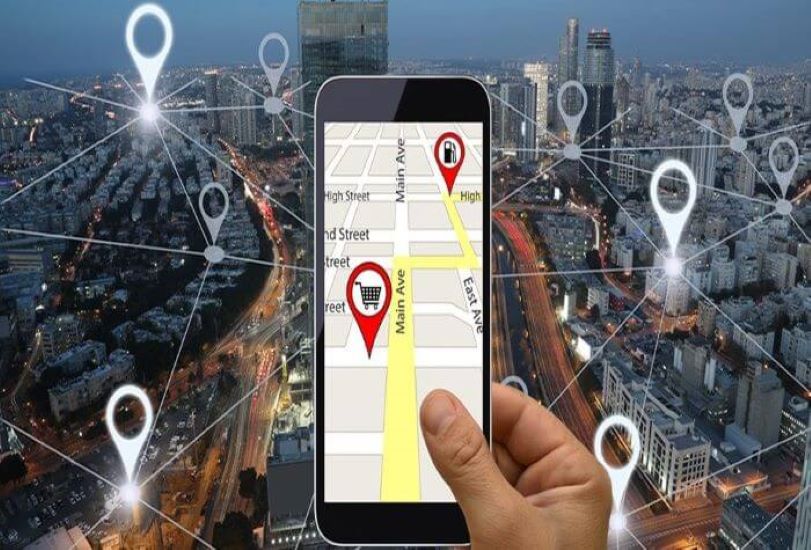
A few weeks ago, we started tracking how the IoT and phone location data could be used to monitor and map Coronavirus-related information. Kinsa Health, for example, uses connected thermometers and an app to map fevers (or a lack thereof) across the United States. Here is a link to their cumulative atypical illness map (how much influenza-like illness above normal expected levels they are picking up), and one to their observed illness map (net overall) for comparison. While this data doesn’t differentiate between the flu and COVID-19, and may also reflect some degree of market penetration bias, it nonetheless provides a snapshot of where some of the country’s fever hotspots may be. By itself, the map’s usefulness is limited, but in conjunction with other maps, it can add a layer of insight into an epidemic that can help researchers, analysts, and decision-makers better understand what is happening on the ground.
On a recent Futurum podcast, we also discussed how a partnership between Tectonics GEO and X-Mode Social allowed anonymized cell phone location to visually track the movements of spring-breakers returning to their hometowns. The same phone location data could be used to track how far, how often, in what volume individuals have recently traveled within or from a viral hotspot.
It therefore isn’t surprising that Google (NASDAQ: GOOGL) should jump into the fray with its own layer of location and contextual data. Enter Google’s COVID-19 Community Mobility Reports: a virtual clearinghouse of up-to-date COVID-19 related reports organized by country, region, and US state. Per the company:
“Google prepared this report to help you and public health officials understand responses to social distancing guidance related to COVID-19. This report shouldn’t be used for medical diagnostic, prognostic, or treatment purposes. It also isn’t intended to be used for guidance on personal travel plans.”
In other words, Google positions this work product as a tool to gauge the local and regional effectiveness of social distancing guidelines and mandates. To that end, it provides timeline-based deltas for a variety of contact-relevant activities ranging from visits to retailers and recreation centers, to physical attendance at one’s usual workplace.
Because I live in South Carolina, I first took a look at that state’s individual report: 26 pages of charts and insight drilling down into individual county statistics for good measure. For the timeframe between February 16, 2020 and March 29, 2020, South Carolinians’ visits to restaurants and other entertainment venues were 38% lower than the baseline, while staying at home increased by 9% over the baseline. Visits to workplaces during that time also dropped 34% from the baseline, and visits to grocery stores and pharmacies fell 11%. New York state, in comparison, showed a 62% drop from its own baseline for visits to restaurants and other entertainment venues, a 32% drop in visits to grocery stores and pharmacies, a 46% drop in commutes to the pre-coronavirus workplace, and a 16% increase in staying home. Two different states, two different policies, two very different sets of results. Regarding privacy concerns, Google says that it has taken steps to make it prohibitively difficult to de-anonymize this data.
Facebook, for its part, is making some of the anonymized location data it collects available to researchers, state authorities, and municipalities. Per Reuters:
“Using the data, which is stripped of identifying information, researchers provide insights like the average distance of trips users have taken in a city and the proportion of residents in each county that have stayed within their 600 square meter home tiles. In New York, for example, researchers found mobility dropped significantly on the weekends but crept back up on weekdays, when many people – particularly those living in low-income neighborhoods – are still required to work.”
As more data-savvy companies compile, map, and contextualize phone location data to add new and increasingly more granular layers to COVID-19 mitigation efforts, the effectiveness of local, state, and national policies regarding social distancing, quarantines, and stay-in-place orders should become increasingly clear. With any luck, better data will lead to better insights, and those insights will enable decision-makers to adjust their policies and mitigation strategies to yield increasingly better outcomes for the communities that depend on them.
To be continued.
Futurum Research provides industry research and analysis. These columns are for educational purposes only and should not be considered in any way investment advice.
Other insights from Futurum Research:
Leaning into Digital to Drive Demand when Face to Face is Impossible
Zoom’s Horrible Terrible No Good Really Bad Week
Coronavirus COVID-19 Presents Threat to Europe’s Tech Startup Scene
Credit Image: Campus Safety Magazine
The original version of this article was first published on Futurum Research.
Senior Analyst at @Futurumxyz. Digital Transformation + Tech + Disruption. Author, keynote speaker + troublemaker. Opinions are my own. I like croissants.

